Inflation is being mismeasured, but not in the way you think
A famous quip by Larry Summers goes something like the following: Would you rather have 1970s healthcare at 1970s prices or 2020 healthcare at 2020 prices?
On the one hand, things were pretty cheap in the 1970s. A doctor’s visit cost $8, a day in the hospital was $70, and many prescription drugs only cost a couple bucks. Private health insurance was probably (at most) 1/10th today's cost on average.
But most people I’ve asked (and Summers has asked) have chosen the latter. And can you blame them? Today we have MRIs, new vaccines and antibiotics, anti-virals and other life-saving therapies, better cancer survival rates, better cardiac care, hip/knee replacements, etc. These advancements often justify the higher costs.
What is inflation?
This may sound like a silly thought exercise, but it is anything but. This is crucial to how we measure inflation. As many people are familiar with today, inflation is the measurement of how prices change each month/year. For example, the Consumer Price Index (CPI) does this by tracking the price of a “weighted average market basket of consumer goods and services purchased by households” over time.
But to measure inflation properly, you need to account for the fact that prices often change because what companies sell, and therefore what consumers buy, changes all the time. The “same” good may be going up in price over time, but that can often be because the quality is going up too.
For example, a car today costs more than it did 20 years ago, but that’s in part because consumers are paying for a better quality car. This can be embedded in the price (ex: all new cars today are by default much safer, more comfortable, etc.) and be due to consumers explicitly buying add-ons (ex: paying for Tesla Autopilot). It’s not apples to apples to look at car prices today vs 20 years ago without adjusting for the changing quality, which is why inflation measures like CPI try to measure prices over time adjusted for quality.
This is particularly important for economic statistics like GDP. Calculating nominal GDP growth isn’t that hard (just count up how much total output was one year to the next). But to measure real GDP growth, you must apply some inflation assumption to separate out the growth just due to prices going up (inflation) and growth due to actual improvements in living standards/productivity. The economy could either be booming (fast real GDP growth) or stagnant (no real GDP growth) depending on what you measure inflation to be.
Coming back to our healthcare example: It’s difficult to measure quality in healthcare (how much better is a surgery one year vs the next year?). But if you’d rather have 2020 healthcare at 2020 prices, that implies that the quality of healthcare has gone up even more than the prices have. You may be paying more, but you are getting a better deal. The quality adjusted price change, therefore, may actually be zero or negative (known as deflation).
What does the actual inflation data say on this? According to the CPI, healthcare goods/services cost 16x more today than 1970 even when adjusting for quality. This equates to a roughly 6% annual inflation rate in healthcare prices. It seems implausible that even after adjusting for quality, healthcare prices today are 16x what they were 50 years ago given how much better people think healthcare is today.

Inflation measurement is more important than you think
What the heck is going on here? Well, we are probably overestimating healthcare inflation (and overall inflation) by underestimating the improvement in quality in the last 50 years.
But what this exercise also shows is how hard it is to accurately measure inflation. It’s really hard to measure quality improvements in a realm like healthcare.
Consider the evolution of cancer treatments. A decade ago, a certain chemotherapy regimen might have been the standard, costing a set amount. Today, we might have a new targeted therapy or immunotherapy that costs significantly more but consumers are clamoring to pay for if it offers a much higher survival rate and fewer side effects. In this scenario, how do we differentiate between genuine inflation and quality improvement? Is the higher price reflective of inflation, or is it a testament to the therapy's enhanced efficacy and the improved quality of life it offers to patients? Whether quality adjusted healthcare prices today are 16x, 10x, 2x or 0.5x 1970 levels is a nearly impossible question to answer with a strong degree of precision using our current tools.
Accurately measuring inflation is important for the reasons you may think. It’s used to set monetary and fiscal policy and to adjust social security and other public benefits. But it goes beyond that. Inflation measures are our window into the past.
Inflation measures are our window into the past.
They can help us answer questions like:
- How much better (or worse) off are we relative to the past?
- What was life like for our parents? And their parents and grandparents?
- Were the 1950s a period of economic stagnation or economic boom?
We need more uncertainty when discussing “inflation adjusted” data
This data has a profound impact on our shared narratives, political and economic beliefs, and understanding of the past. But consider how little we discuss our uncertainty around it! Any time someone writes about something “inflation adjusted” or in “real” terms (e.g. real GDP, real wages, inflation adjusted costs), they are taking the inflation data as 100% correct without a second thought.
Let’s take the argument below: some argue that Americans have seen their purchasing power “hardly budge” since 1964. The entirety of this argument rests on the inflation data being accurate.
What if, because of the improved quality of goods and services, inflation was 3% annually instead of the 4% assumed in the chart? The headline would instead read “American purchasing power doubles compared to 40 years ago.” Very small changes in inflation can have large effects the further out you look.
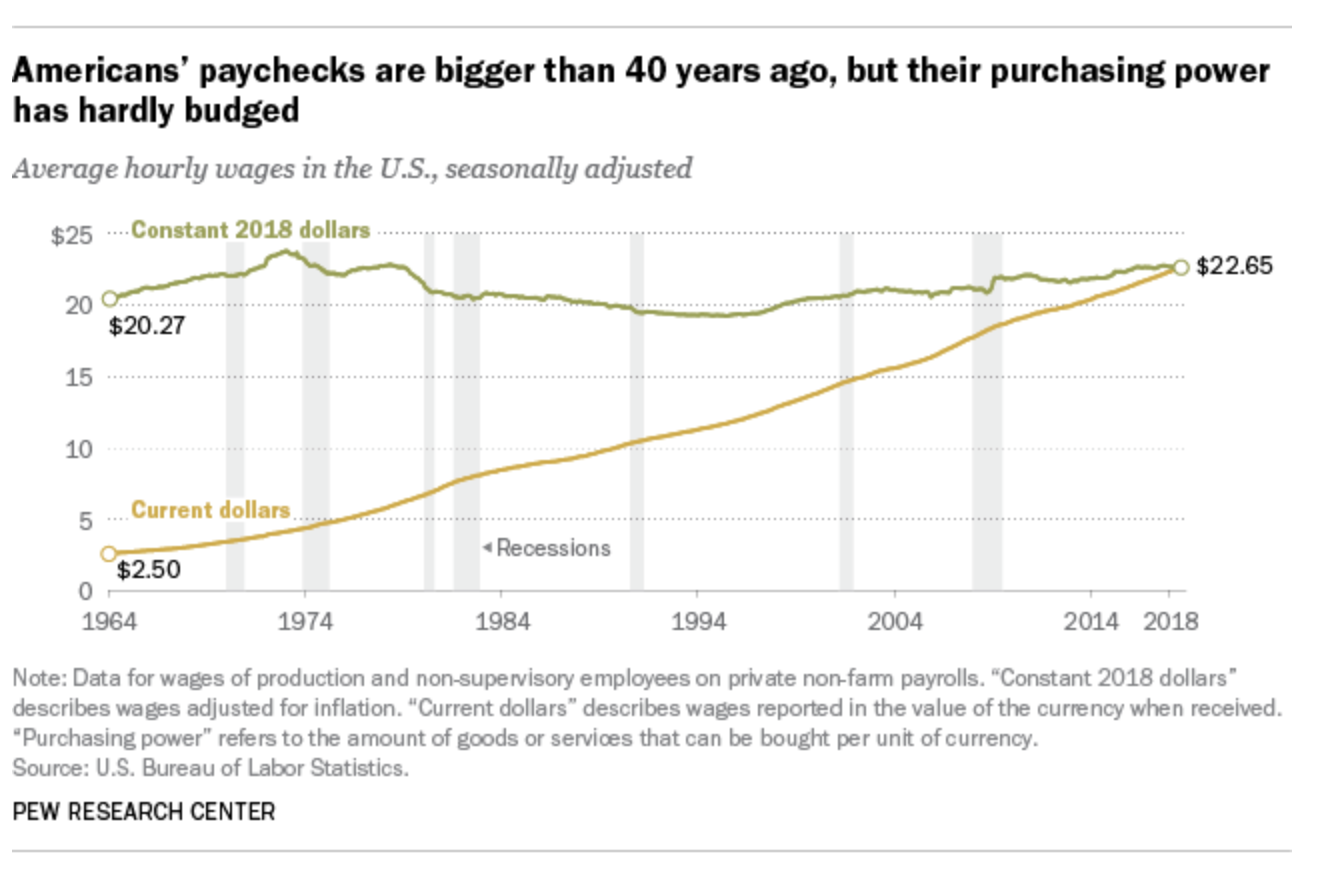
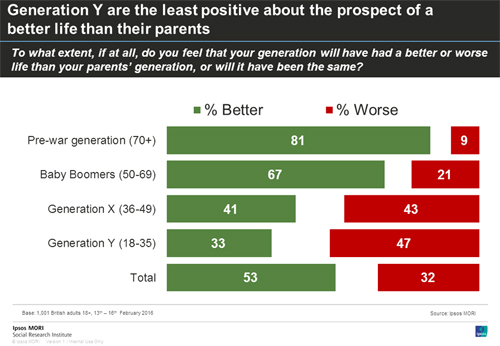
If the inflation data isn’t correct, many common political arguments may not be either. Wage growth may not actually be grinding to a halt, and our generation may actually be better off than our parents (more on that below). At a minimum, you should have more uncertainty with many of these common claims.
A review of inflation and how it’s calculated
Let’s dig into what is going on here. Remember, inflation statistics measure the change in prices over time. Because every individual spends money on different things, the CPI looks at a representative basket of goods/services over time.
In order to do this, collectors from the Bureau of Labor Statistics (which produces the CPI) “visit (in person or on the web) or call thousands of retail stores, service establishments, rental units, and doctors' offices, all over the United States to obtain information on the prices of the thousands of items used to track and measure price changes in the CPI.” So yes, you may run into your friendly neighborhood BLS collector in the cheese aisle on your next grocery store trip.

If Americans could purchase exactly the same goods of the same quality every year, the calculations would be simple.
The Two Biases: Quality Change and New Goods
But as we have discussed, the actual consumer’s basket changes over time as the quality of existing goods changes (quality change bias) and new goods are added (new goods bias).
We talked a bit about quality change bias already and the difficulty in measuring quality improvements in things like cancer treatments. But let’s walk through an easier example (TVs) to see the impact in the data. The prices people pay for TVs has not seemingly changed very much over the last 20 years or so, but the quality has gone up a lot. As a result, after the quality adjustment, prices for TVs according to the CPI have fallen by 95% from 1998 to 2015.

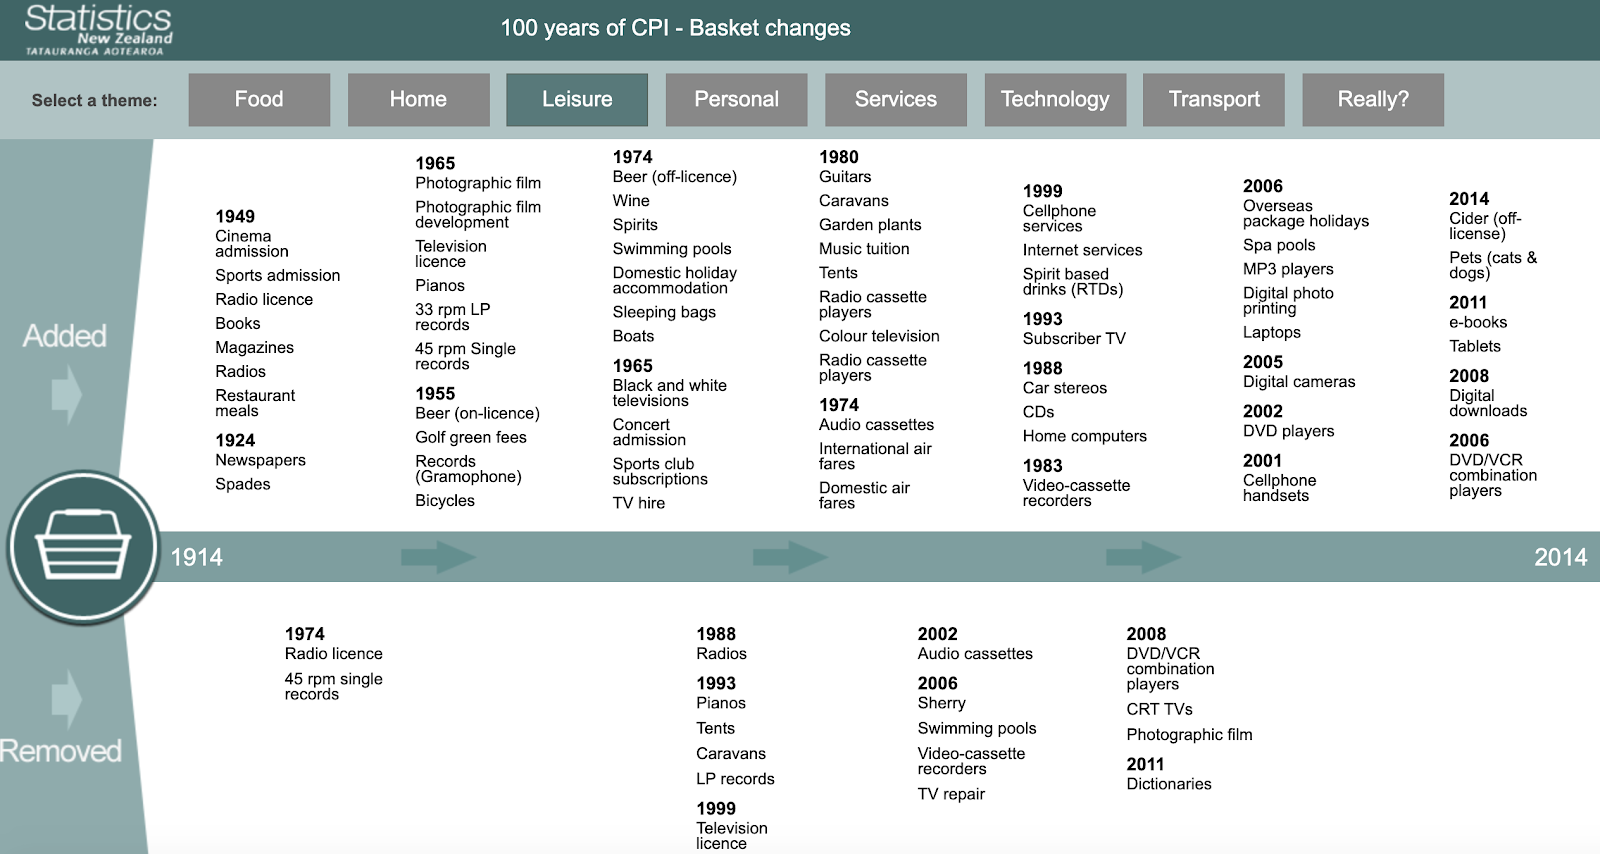
Then there is new goods bias, which refers to the fact that new goods are created/invented and then added to the CPI basket later on. Many Americans today buy things which simply didn’t exist in 1970, so you can’t just compare the prices of everything today vs 1970!
Consider the device on which you are reading this (smartphone, computer, etc.) or the healthcare examples that began this post. The further back you go, the greater the problem this is. New Zealand’s statistics agency actually has a cool website where you can see the introduction and removal of different goods in each category over time (see the “leisure” category below).
Not new but not solved!
If you are reading these with an economics background, you might say: “Charles, these aren’t new issues!” And that’s true; the Boskin Commission in 1995 was tasked by Congress with measuring the accuracy of the CPI at the time. This was something of particular importance to Congress since annual increases in Social Security are indexed to CPI.
The commission concluded that we underestimate quality improvements and that the CPI inflation was overestimated by 1.1% per year due to the biases listed above (among others). Since then the BLS claims new methods have accounted for the reports conclusions and the biases are “small at best”.
But a 2017 paper by the late Martin Feldstein makes it clear that we are understating quality improvement by way more than the Boskin Commission suggests and that the BLS has done little to fix the problem. I would recommend you read the paper in full, but I will do my best to summarize.
How we measure quality change
Bear with me as I get a little wonky. As Feldstein notes, the BLS uses two main methods to adjust for quality: the hedonic quality adjustment method and the resource cost method.
Hedonic quality adjustment is a regression based approach used for measuring inflation in a number of goods including apparel, appliances and electronics (full list here). It works best for products with a lot of data where you can estimate the impact of a product’s different features (like TVs!). When hedonic quality adjustment is not used, the resource cost method usually is. This is an input based method where the BLS estimates the change in price that is due to an increase in the cost of producing that item.
Both of these methods have serious flaws (see appendix). Dozens of studies have come out showing that official measures overestimate inflation and underestimate quality improvements in everything from semi-conductors to digital content. Some of my favorite examples are below:
Cameras
Today, everyone has a supercomputer in their pocket with a high quality camera. And yet, our price indices do not reflect this, as the CPI tracks the price of “traditional photography equipment” (film, developing, cameras) without accounting for smartphones. According to the BLS, the price of photography has only fallen 30% in total since 1985, despite the fact that everyone has an insanely cheap, insanely powerful camera in their pocket.
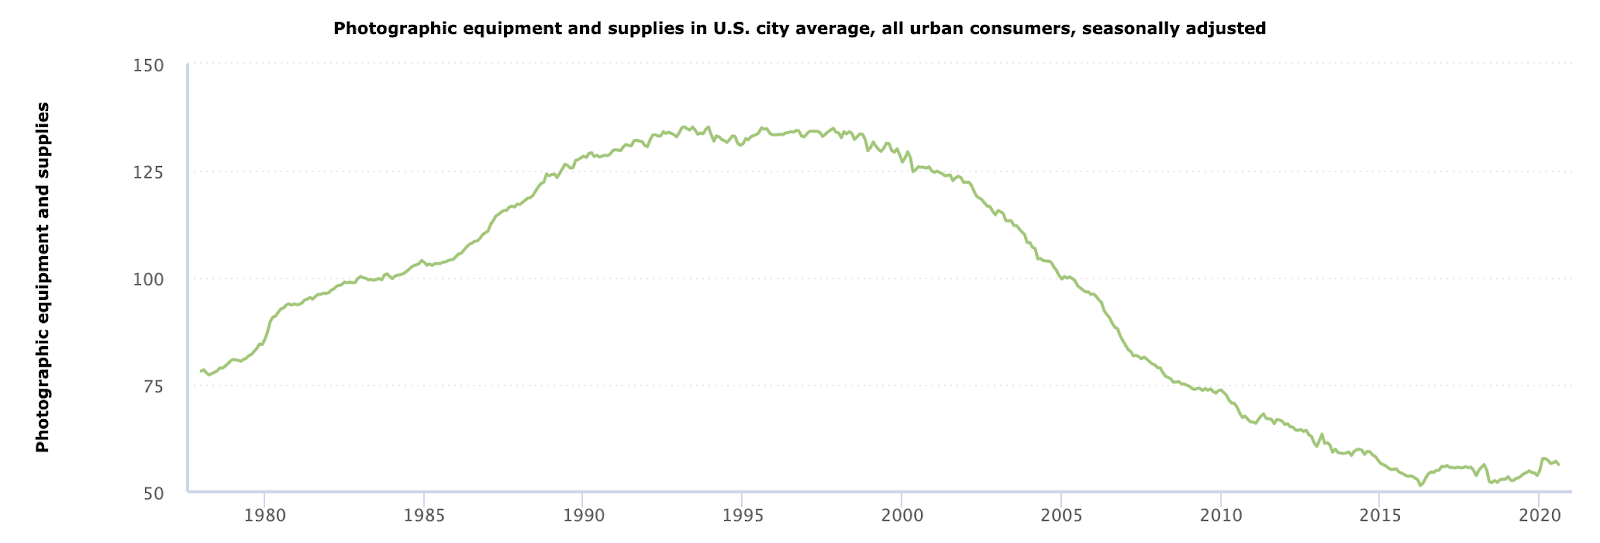
In reality, the price of photography has probably fallen by 99% or more. In 1995, “A Fujix Nikon camera that cost $20,000 ($31,000 in today’s money), could shoot 1.3 megapixel photos, and used a removable 131MB hard drive that could store 70 photos.” And we aren’t even accounting for the ability to share, print, and store nearly unlimited numbers of photos for free!
As Hal Varian points out in a fascinating presentation, this same analysis can apply to many things now bundled into smartphones: GPS, land lines, game machines, ebook readers, computers, movie players, audio players, maps, password generators, fitness monitors, alarm clocks, web browsers, calculators, recording devices, video cameras, etc.
Digital content
As Stephen G. Cecchetti and Kermit L. Schoenholtz write, digital content has become exponentially better but this has not been accounted for in conventional inflation metrics. Amazon Prime is giving you more and more for your subscription each year with no impact on inflation:
“Recent work suggests that we are dramatically underestimating the quality improvements associated with digital content – things like on-demand movie streaming services. (Think of Amazon Prime, where for a $99 per year subscription you can watch any of the tens of thousands of titles whenever you want, in addition to getting two-day delivery of your Amazon orders.) Put differently, the improved quality of household internet services (in terms of content and speed) is unlikely to be fully reflected in the measured price, which rose by about 0.9% annually in the years after 2007.”
They also point out that many things we get are free (like YouTube, Facebook, or Google Maps) so there is no price index for them to even impact as they improve over time (as customers aren’t “purchasing” anything!)
Healthcare
Many examples like the ones above are dismissed as being too small to have a big impact on overall inflation. Healthcare, at 17% of GDP, certainly cannot. As Feldstein notes repeatedly, our healthcare CPI looks at costs but does not look at health outcomes or patient satisfaction.
We’ve seen innovations in procedures and treatment which are unlikely to show up in our statistics. Cataract surgery has gone from requiring patients to spend more than a week immobilized in a hospital to a quick outpatient procedure. Laparoscopic surgery has reduced hospital stay and recovery times. Cancer survival rates have increased across the board. Statins alone have lowered cholesterol levels and rates of heart disease.
You get the point. Healthcare has become much more expensive (which is accounted for in CPI) but also much better quality (which is not).
Other
There are a ton of other random and fun quality adjustments we never consider, some of which may even go in the opposite direction.
- How much better are movie theaters today than 50 years ago? Those lie flat seats are nice, as is IMAX.
- Does fruit taste better or worse than it used to? Is it less nutritious, as some studies have argued? Even the prices of apples may need some quality adjustment!
- Has the experience of flying gotten better or worse over time? Long lines at the airport are now embedded in the price.
- What about college? Is the increase in price really just inflation or is it a better quality education (doubtful in my opinion). Or maybe all that money has gone into making college a more fun experience.
Like smartphones, many other goods are also bundles. The BLS measures the price of a home over time and adjusts for the quality homes themselves over time (ex: number of bedrooms). But when you buy a home you are also buying the experience of living in that area and all that comes with it (public schools, crime, etc.). If crime goes up in an area, and home prices drop as a result, it’s really quality going down and not price (no “real” gain here!). Similarly, if public schools get a lot worse, that is a real impact that should be incorporated in measuring our inflation (but is not today).
These are just a few examples, which gives you a good sense of how difficult and far-reaching this problem is.
New goods bias
So it’s clear that the BLS does not adequately adjust for the changing quality of existing goods from year to year. But it suffers even more with new goods. When a new good/service is invented, it does not immediately enter the CPI basket. It is only added once spending is large enough and the product is sufficiently widespread.
Let’s take cell phones. As one economist wrote in 1999:
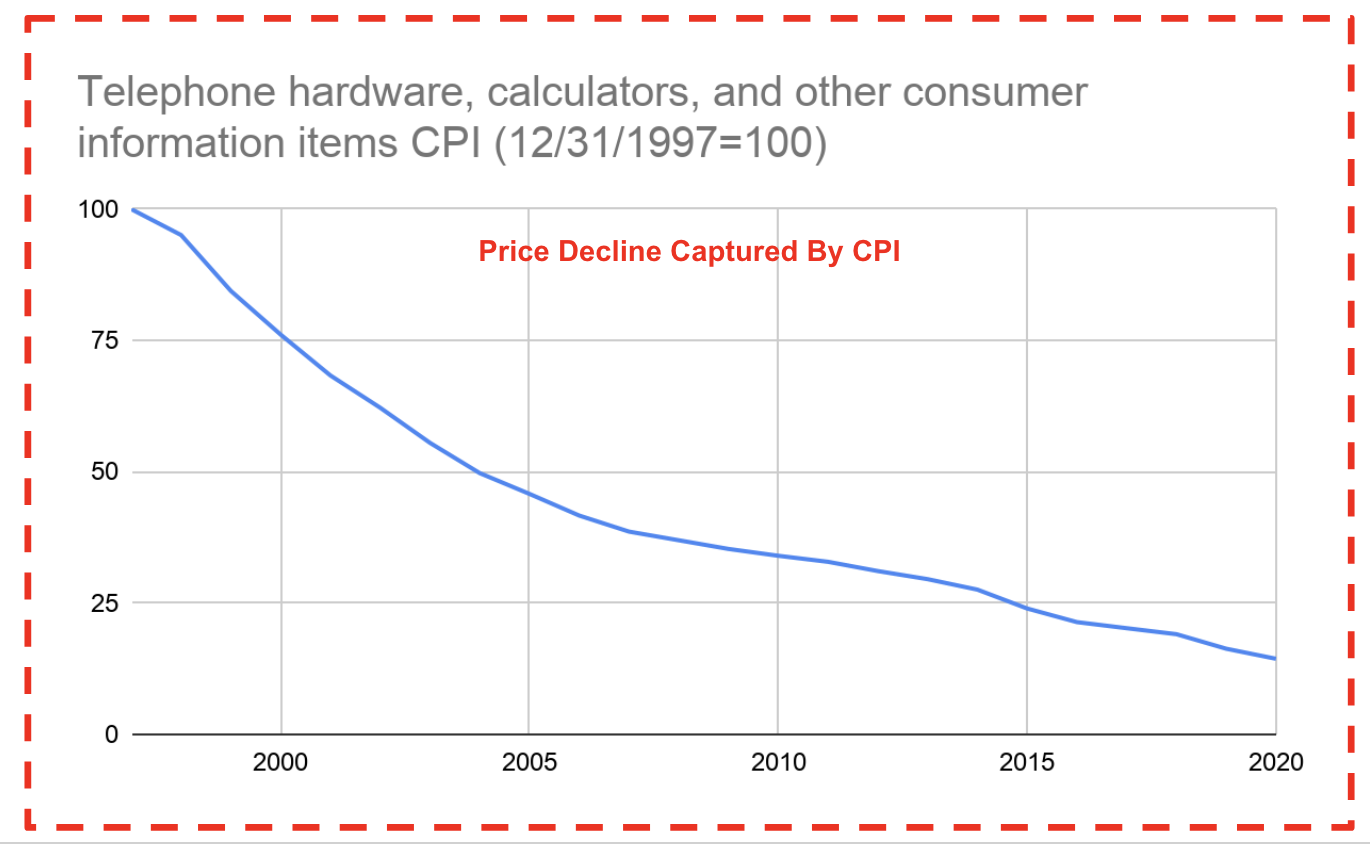
“The Bureau of Labor Statistics (BLS) did not know that cellular telephones existed, at least in terms of calculating the Consumer Price Index (CPI), until 1998, when they were finally included in the CPI. By 1998, 15 years after the introduction of cellular telephones, over 55 million Americans were using cellular and PCS, mobile telephones based on the next generation of cellular technology. When the BLS finally included cellular telephones in the CPI for the first time in February 1998, it had no effect on the CPI because the BLS reported that the price of cellular had not changed from the previous month.”
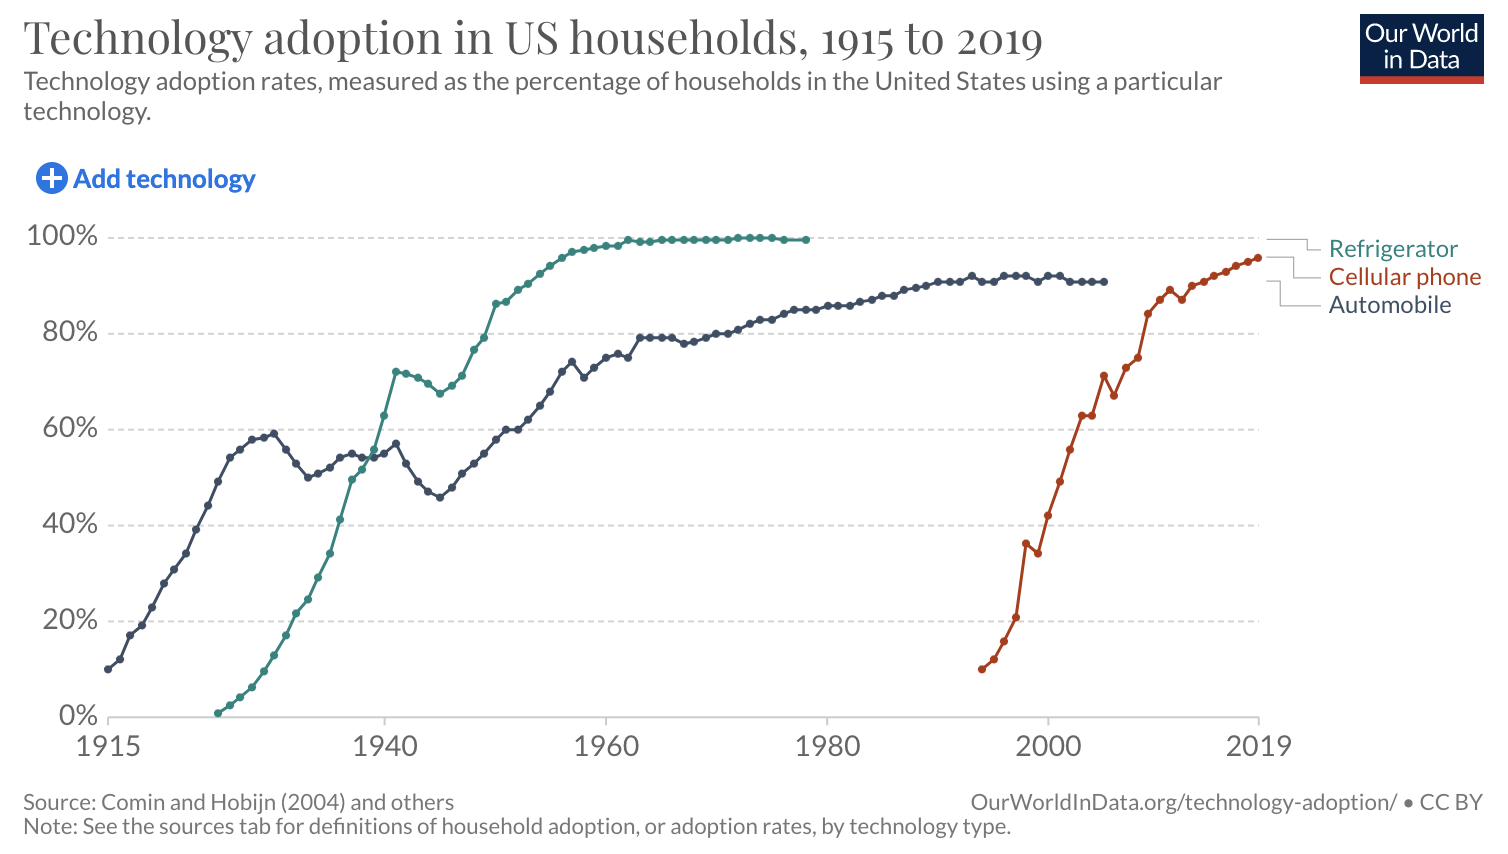
Similar delays occurred for the inclusion in the CPI of refrigerators (added in 1934 when 30% of households had one) and automobiles (added in 1940 when 50% of households had one).
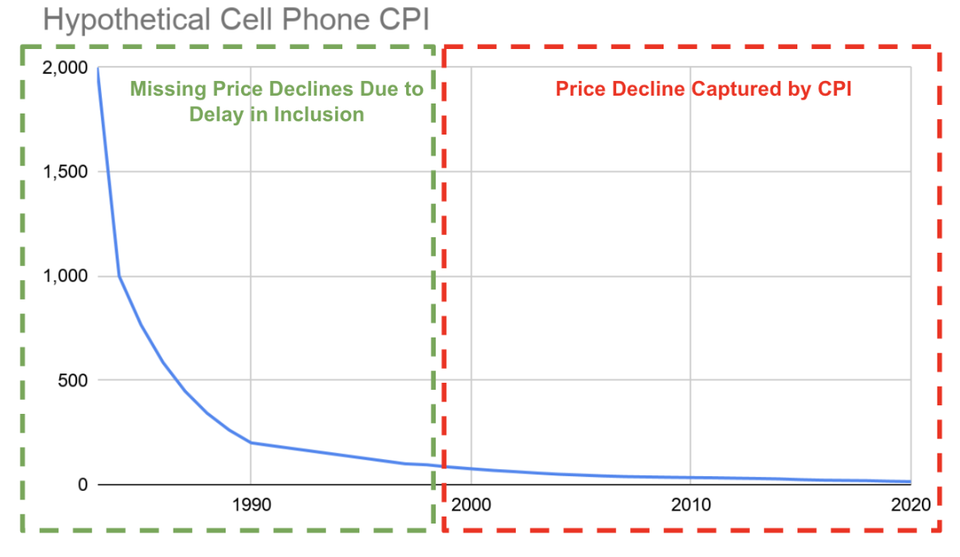
What is the impact of this delay? Let’s take cell phones again. The BLS (taking its quality adjustments at face value…) has recorded an 86% quality adjusted price decline in the price of cell phones since 1997.
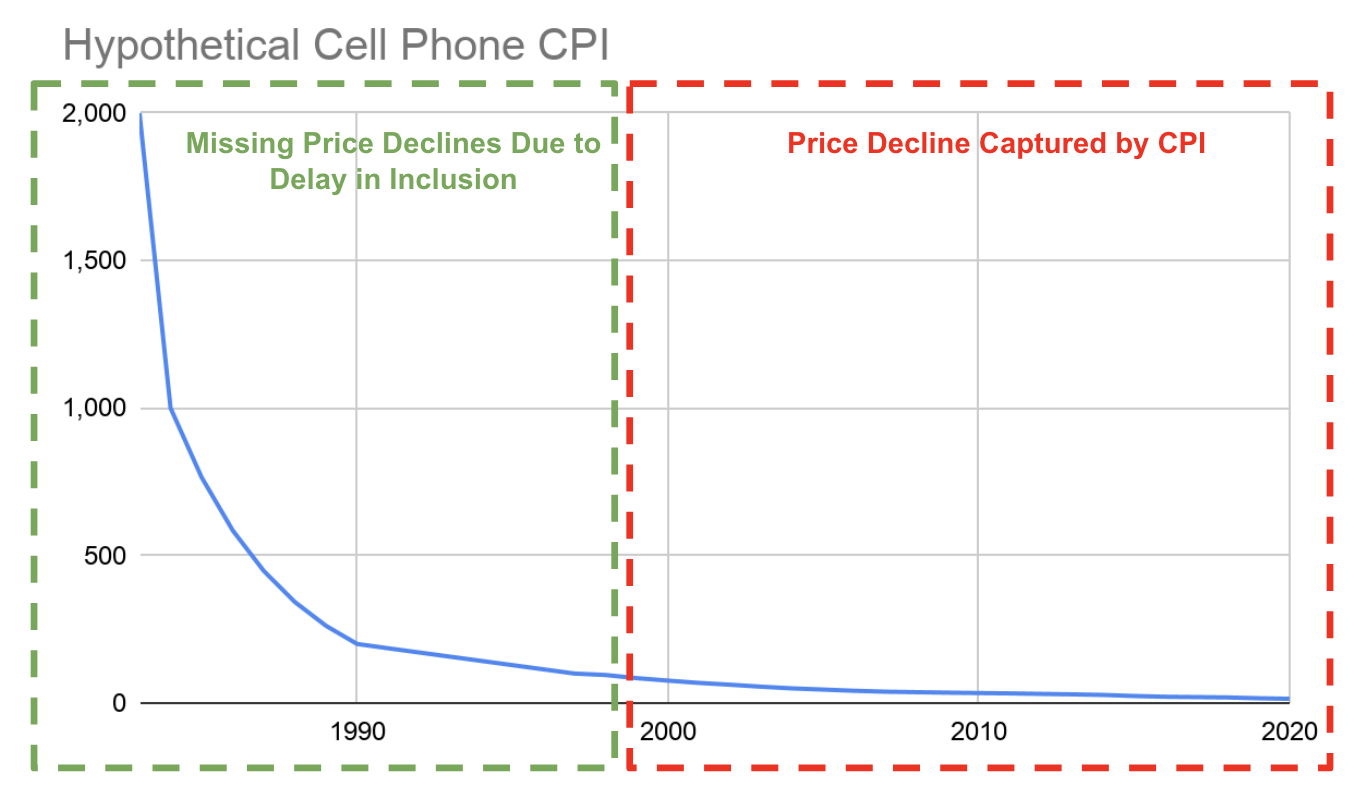
But cell phones were introduced in 1983 with the Motorola DynaTAC retailing for $3995. That means the CPI missed the largest price declines, from 1983 to 1998.
But consider that $3995 is just the first price published for a commercially available cell phone. There is some price you could have paid to get a cell phone before then, we just don’t know the exact amount. In 1982 (the year before one was commercially available), maybe you could have paid 200k to get a cell phone company to give you an early model. Maybe in 1978, the richest person in the world could have spent one billion dollars on creating a cell phone for themselves (Tony Stark style). But at some point, the price goes to infinity; there is no amount of money a person in 1930 could pay to have a cell phone.
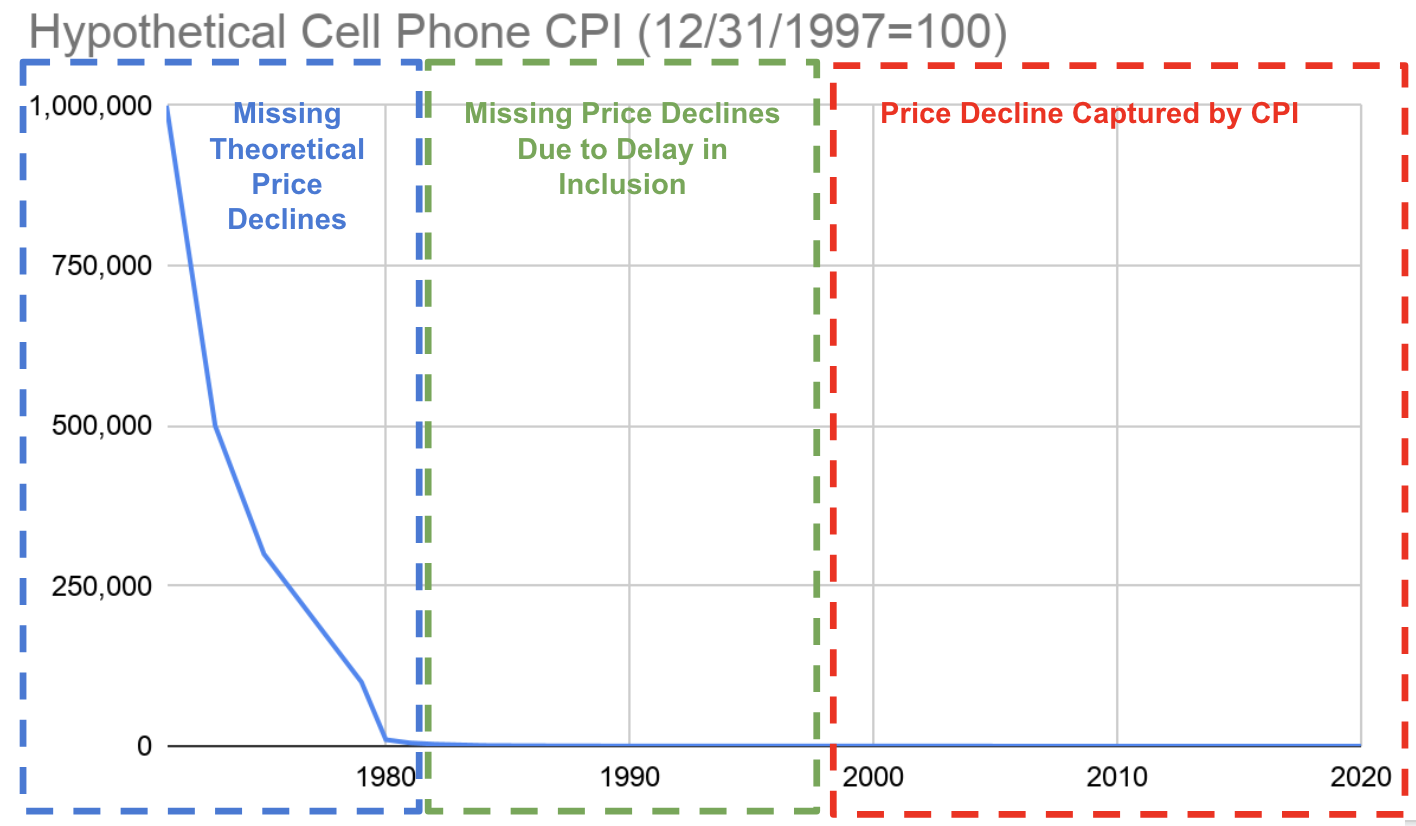
To be clear, including the price declines before 1983 (in blue) is unlikely to have a huge impact on cell phone CPI because so few people used them. But the missing price declines in blue and green show how we only start measuring the quality improvements to our lives once a good is already well established. We may be capturing the improvements in cell phones from 1998, but not the general improvement of the cell phone vs the landline. The same goes for refrigerators, cars, and any other new invention.
Math behind new goods bias -> inflation
The math behind the impact of new goods bias on overall inflation is roughly (weight in CPI basket) * (price change).
Let's say in 1997, cell phones would have been 2% of the basket of goods and its quality adjusted price declined by 20%. Then the reduction to overall prices would have been 2% * 20%=0.4% decline in overall prices.
Similarly, let's say the weight in the CPI in the CPI basket 1983 (the first year the cell phone came out) should have been 0.1%. Even if the quality adjusted price that year fell by 90% (which is plausible given it was just introduced!), the impact on overall CPI would only be a 0.09% decline, much less than the impact in 1997.
For each good, the size of the "missing price decline" will depend on when the good was added to the CPI basket, how big a weight it was at that time, and how much prices declined during the time before it was added to the CPI basket.
If things are better today than statistics imply, why don’t people agree?
So inflation measures tend to overestimate inflation by some material amount (though we’re not exactly sure by how much). What this implies that many of the narratives we tell ourselves today are likely to be wrong (they are using bad data!). Things today are better than the economic statistics imply because inflation has been lower than we think. We have gotten a lot richer than the statistics imply, and claims like we heard above (Americans have seen their purchasing power “hardly budge” since 1964) should be treated with deep skepticism. We are likely much richer than our parents and grandparents.
And yet, I can see you shaking your head. This notion really doesn’t resonate with most people today. People, particularly young people, feel like things are worse today. They are less optimistic about the future, and think they have been given a bad deal. How can we reconcile this?
First, things may be better but the rate of improvement has still likely slowed. My argument does not mean that the “productivity slowdown” is a myth. The same argument about inflation mismeasurement today also applies to the past. I actually think it’s plausible that mismeasurement was even higher in the past. Do we think the BLS was any better at quality adjustment for the air conditioning, refrigeration, electricity, or television when they were introduced? I think generally the frustration people feel is due to the rate of change slowing, not because we are actually worse off (I’ll write more about this in an upcoming post). “We wanted flying cars, instead we got 140 characters” is still a fair criticism of our recent progress.
Second, there is a nuance here around inflation I haven’t discussed. Consider the case of refrigerators. A modern refrigerator today, with its energy efficiency, digital controls, and water dispensers, might cost $2000. When adjusted for quality, it may be seen as (I’m making up a number) 50% "cheaper" than a basic refrigerator from the 1970s. However, those gains are not realized because appliance stores no longer stock those simpler 1980s refrigerators for purchase. So, even if you preferred the older, more straightforward, and (most importantly) cheaper model, it would be difficult to find it in the market. We see similar patterns with cars; even if the 2023 cars are much better quality than the 1970 ones, you can’t actually buy that cheap 1970s version because it’s not made anymore and there are limited numbers on the secondary market. The same goes for homes: modern houses might have enhanced "quality" but come with a hefty price tag.
Therefore, especially for the poor, the boon of these quality advancements might not be fully realized because the cheaper versions of the goods have been discontinued and customers only have the option of buying the higher quality, but also more expensive version of the product. I think this is a key reason people don’t feel like things have improved as much.
Third, I think this is all a testament to the power of the media and shared narratives. Young people today were not alive in 1970. Even the people alive in 1970 today barely remember it or have nostalgic bias for the past, so they aren’t reliable narrators. And don’t even bother trying to compare today to 1920. So if people start talking about how bad things are today compared to the 1970s, using some flawed economic data we just went over, how is a 20-year-old really supposed to know any better? It ends up being just about vibes at the end of the day.
A call for humility (and research)
If there’s anything I hope you take away from this piece, it’s a healthy bit of skepticism when evaluating economic or political arguments around change. Any analysis looking at real income, real GDP, real wages, etc. will be increasingly unreliable the further back you look. When an economist has strong views about the real GDP growth from 1920-1930 and how that compares to today, you should raise your eyebrows.
But we shouldn’t just throw up our hands. Inflation mismeasurement is severely underresearched and we need to better understand it to truly understanding how quality of life has changed. We need to understand dynamics like I mentioned above, where lack of ability to purchase lower quality, cheaper goods limits the benefits of technological innovation. There are also many goods that don't make their way into CPI because they aren't purchased directly (ex: government services, public schools quality) that need to be accounted for to get a more accurate picture of how our quality of life has changed.
And this isn’t just for the academic economics world. For folks working in “Progress Studies” (ex: Stripe Press), this research is crucial to understanding how progress has actually occurred in the last 100 years. I look forward to seeing more of it.
Appendix
There are a number of methods the BLS uses to determine quality change, from the not bad to the downright baffling. Here is the list of all CPI goods and what quality adjustment they use.
First off, the BLS “asks the producer of each good or service whether there has been a change in the product made by that producer” (seriously). If a change has occurred, the BLS does one of a few things:
Hedonic quality adjustment: The BLS uses a regression based approach to calculate the contribution of different features/factors to a good’s price. For example, a hedonic price regression for televisions in 2020 might include variables like screen size, pixels (4k, 1080p, 720p), whether it’s a smart TV, etc (see the actual regression example from the BLS). For 2021, the BLS would use this model to predict what the price of a new TV “should be” based on the models and assume the difference is due to quality change.
Hedonic quality adjustment is used for a number of goods including apparel, appliances, and electronics (full list here). In theory, hedonic regressions should work well. For things like TVs and iPhones, the predictable release cycle and tons of data on features should make it easier to measure quality change. However, even prices for something like the iPhone appear to be significantly off.
2) Resource cost method: When a hedonic regression is not used, the BLS often uses the “resource cost method” of quality adjustment. When a quality change has occurred, the BLS asks about the “marginal cost of new input requirements that are directly tied to changes in product quality.”
Now here is the crazy part: As Feldstein notes, with this method “there has been a quality improvement if and only if there is such an increase in the cost of making the product or service.” This means “the resource cost method can also treat a decline in production cost as evidence of a decline in quality,” which is usually the opposite of how things happen in reality.